What our retail ERP solution can do for you
Our retail management solution of choice is an all-in-one system that extends Microsoft Dynamics 365 Business Central with the industry-specific functionality of LS Retail's LS Central to provide one single platform for financials, POS, store operations, supply chain, inventory, e‑commerce, and loyalty.
Unified Platform
Replace fragmented tools with one single source of truth. Stop searching across disjointed databases and eliminate repeat entry.
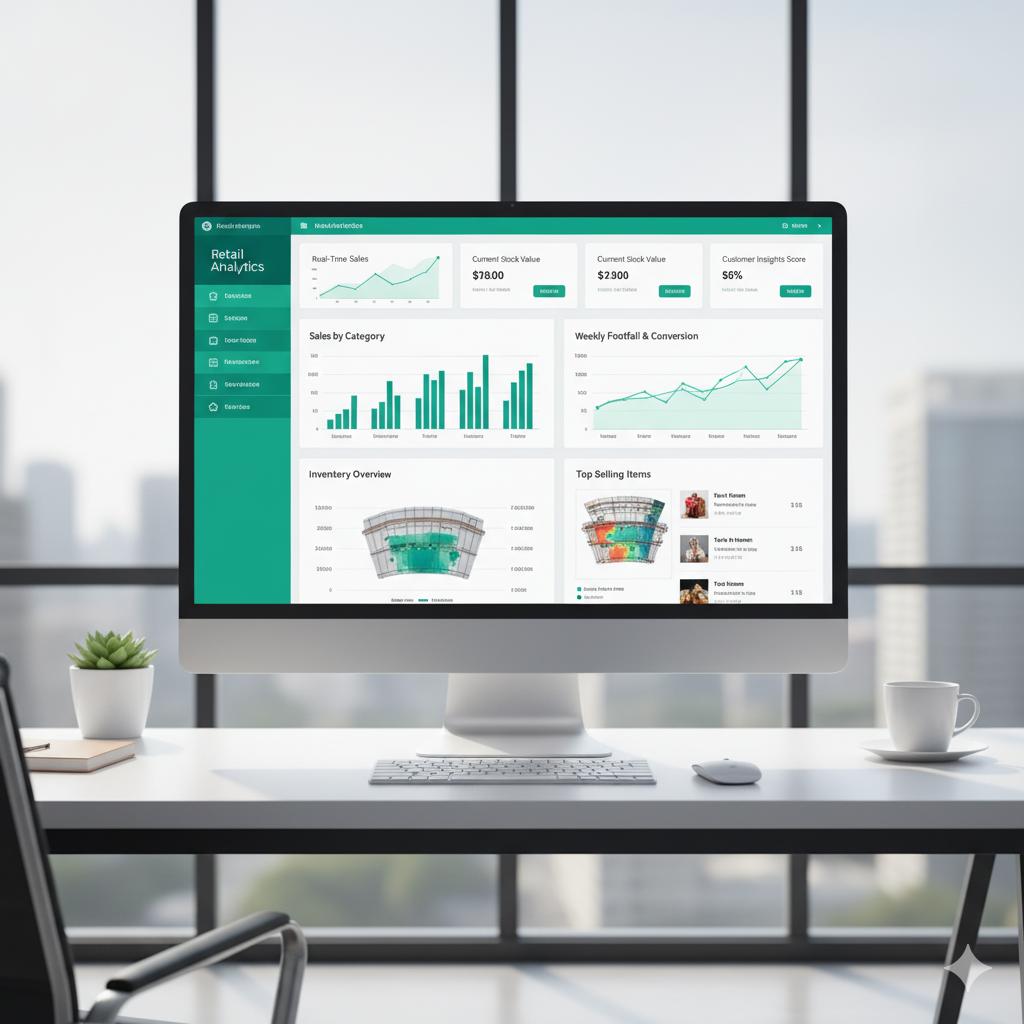
Visible Performance
See business performance at a glance. Act instantly to cut costs, grow revenue, and identify high-value opportunities.
Lift Loyalty
Understand your customers better. Use data-backed insights to drive retention and improve customer lifetime value.
Why Teams Switch
-
Unified SKUs & Stores
-
Role‑based Dashboards
-
Automated Refresh
How it works
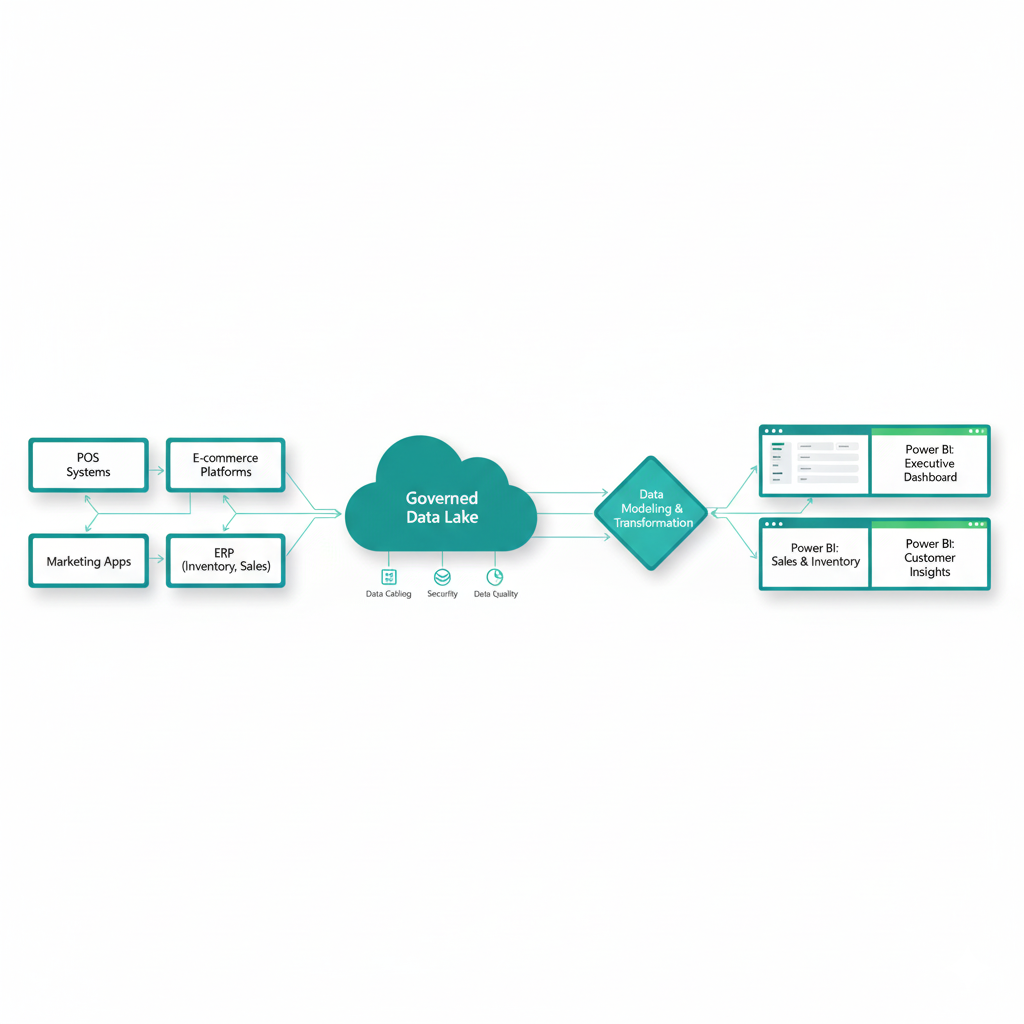
Integrate
All sources—Shopify/Shopcada, POS, ERP, ads, CRM—into a governed lake with unified SKUs, stores, and calendars.
Model
Star schema (Sales, Inventory, Customer, Product, Store) with conformed dimensions, incremental refresh, RLS, and data-quality checks.
Visualize
Role-based dashboards (Exec, Merch, Store Ops, Marketing) with drillthrough, mobile views, and field parameters.
Act
Alerts (low stock, margin erosion, promo uplift), reorder triggers, and export/sync to your tools.
What you get in 2–4 weeks
-
Baseline lake + semantic model
-
6 core dashboards & KPIs
-
Hourly/daily refresh pipelines
-
Data dictionary & KPI catalog
-
RLS roles & access setup
-
Handover & training session
Dashboards included
- Executive
- Sales & GM%
- Demand & Inventory
- Customer & CLV
- Pricing & Promo
- Merch & Assortment
Integrations
- E-commerce
- POS
- ERP
- Ads
- CRM
- DB/APIs
- Payments
- Shipping
Dashboards
Prebuilt pages tailored to common retail decisions.
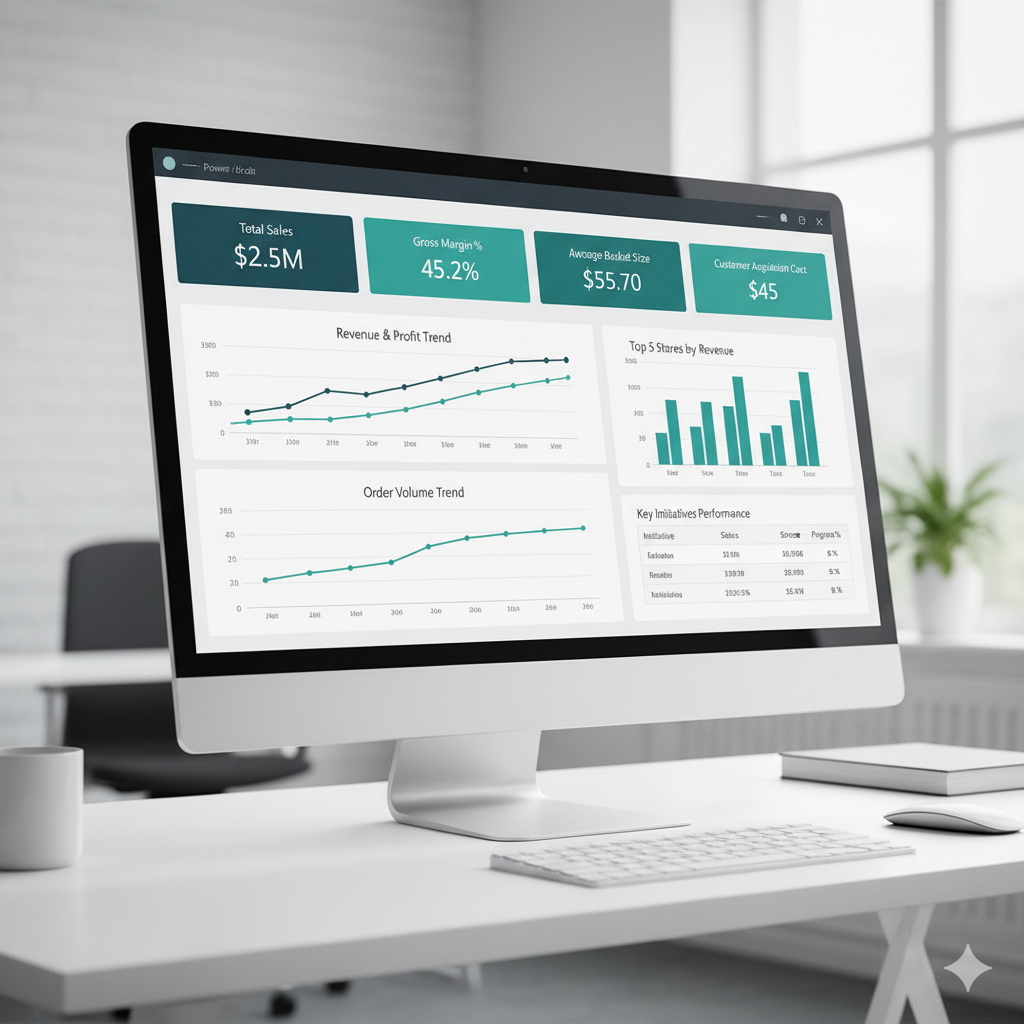
Executive Overview
Sales, GM%, basket size, store ranking, and trendlines.
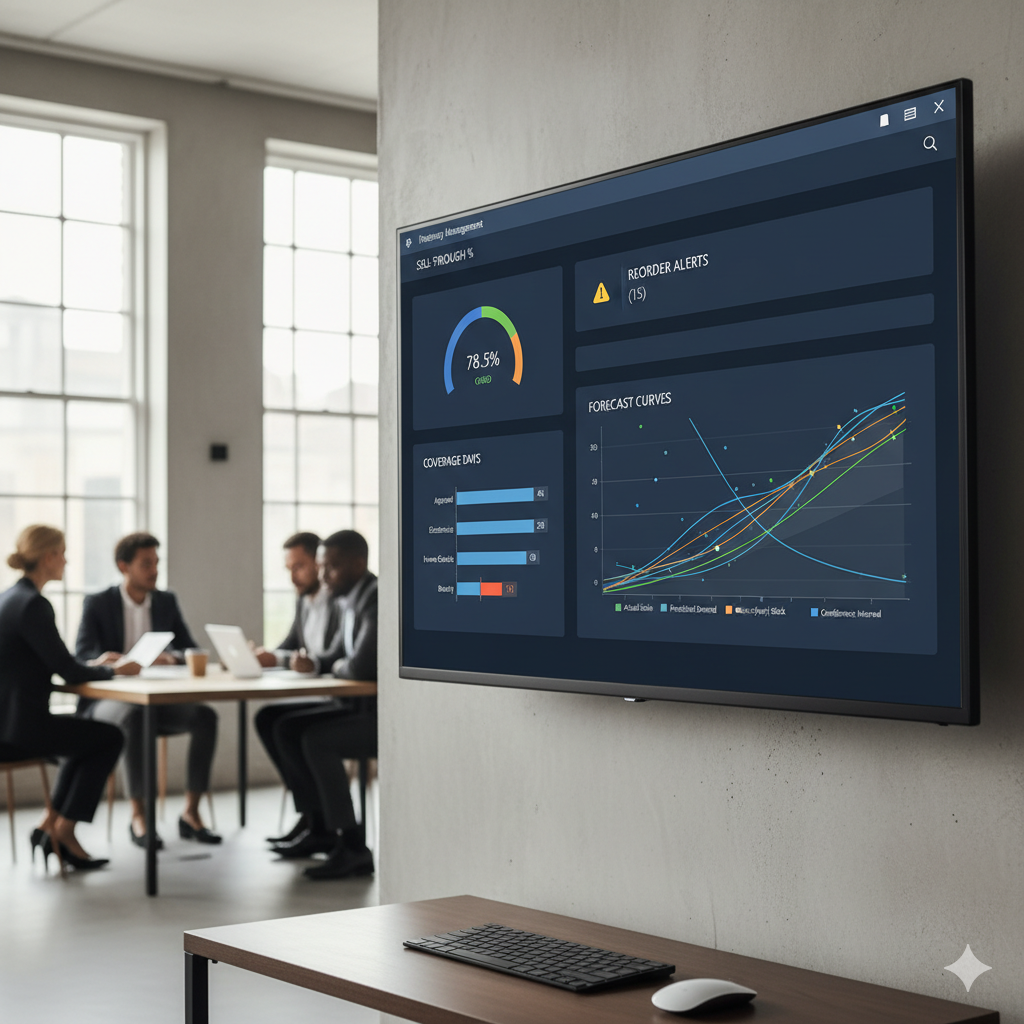
Demand & Inventory
Sell-through, coverage days, reorder alerts, and forecast.

Customer & Loyalty
Cohorts, CLV, repeat rate, and promo effectiveness.
Case study: Budget jewellery retailer
8,000+ SKUs across necklaces, rings, earrings, bracelets.
-
Unify data from e-commerce, POS, ERP into one model.
-
Score products on sales, profit, ratings to surface winners.
-
Right-size stock via coverage and sell-through alerts.
-
Iterate promos using uplift attribution and basket analysis.
Results in 90 days
-
+12% revenue after promoting best-sellers and clearing slow movers.
-
$200k dead stock identified and liquidated.
-
90% faster reporting through automated refresh and templates.
-
+20% marketing ROI by targeting high-value cohorts.

FAQ
What data sources can you connect?
Shopify/Shopcada, POS, ERP, CRM, ads platforms, spreadsheets, and databases via connectors/APIs.
How fast can we go live?
Baseline dashboards typically in 2–4 weeks depending on data quality and scope.
Will we keep our existing tools?
Yes. We integrate and model data without forcing system changes; we focus on the analytics layer.
Ready to see your retail KPIs in one place?
We'll connect your sources and deliver a baseline dashboard, then iterate with your team.